State value of Value Function
Objective function
- : true state value
- : estimated state value
- goal: find an optimal so that can best approximate for every
- policy evaluation problem, later we will extend to policy improvement
To find the optimal , we need two steps:
- define an objective function
- derive algorithms for optimizing the objective function
The objective function
- goal: find the best that can minimize
- the expectation is with respect to the random variable
如何求上面这个期望呢?
上面这个期望其实也可以写成,如果想求出来期望就必须先知道random varible S的分布;我们之前是怎么求期望的呢?之前都是可以通过Monte Carlo大量模拟的方法去求得期望的,但这里用模拟的方法求期望变得不太现实,退而求其次,我们可以用模拟的方法求得S的分布,得到分布求期望就可以写成概率形式的平均了。
What is the probability distribution of ?
- This is new. In the tabular method, we do not need to consider this.
- There are several ways to define the probability distribution of .
- uniform distribution:
- stationary distribution: , where is a given policy
Uniform distribution
- treat all the states to be equally important
- the objective function becomes
- drawback: the states may not be equally important
- some states may be rarely visited by a policy
- does not consider the real dynamics of the Markov process under the given policy
Stationary distribution
- describes the long-run behavior(长期行为) of a Markov process
- Stationary distribution(稳态分布)
- let denote the stationary distribution of the Markov process under policy
- the objective function becomes weighted squared error
- more frequently visited states have higher values of
- their weights in the objective function are also higher than those rarely visited states
- More detail, see stationary distribution
Optimization algorithms
- use gradient-descent algorithm to minimize the objective function
- the true gradient is the true gradient involves the calculation of an expectation
Then we have
Use stochastic gradient to replace the true gradient( merges to )
- we don’t know the true state value here, solution:
- use the methods in TD, replace by another value(approximation)
- use MC, replaced by
- use TD, replaced by
Implementation
这里仅仅是做了estimate the state values of a given policy (policy evaluation)
Selection of function approximators
How to select the function ?
- use a linear function approximator
- ()
- : feature vector(polynomial basis, fourier basis) of state
- widely used before
- use a neural network as a nonlinear function approximator
- input: state
- output: estimated state value
- parameters: weights and biases of the neural network
Linear function approximator
Linear function approximator: , then we have
Substituting the gradient into the above TD algorithm
yields
which is the algorithm of TD learning with linear function approximation(TD-Linear)
优缺点
- 缺点:难以选择合适的特征向量(feature function 不好选)
- 优点:理论性质更好,线性函数逼近的理论性质比非线性函数逼近更好(可解释可理解)
- tabular representation是linear fuction representation的特例
Tabular representation(special case)
Show that tabular representation is a special case of linear function representation
- Consider a special feature vector for state : (one-hot encoding) where is a vector with the -th entry as 1 and the others as 0
- In this case: where is the -th entry of
- Recall that the TD-Linear algorithm is When , the above algorithm becomes This is a vector equation that merely updates the -th entry of
- Multiplying on both sides of the equation gives which is exactly the tabular TD algorithm (which is called TD-Table here)
Summary: TD-Linear becomes TD-Table if we select a special feature vector(one-hot encoding)
Illustrative examples
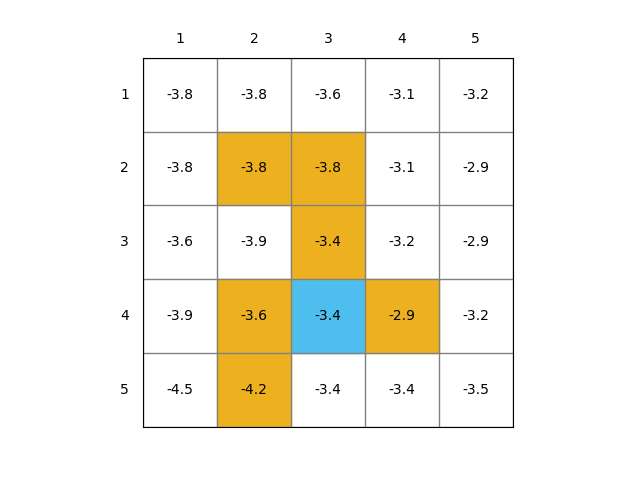
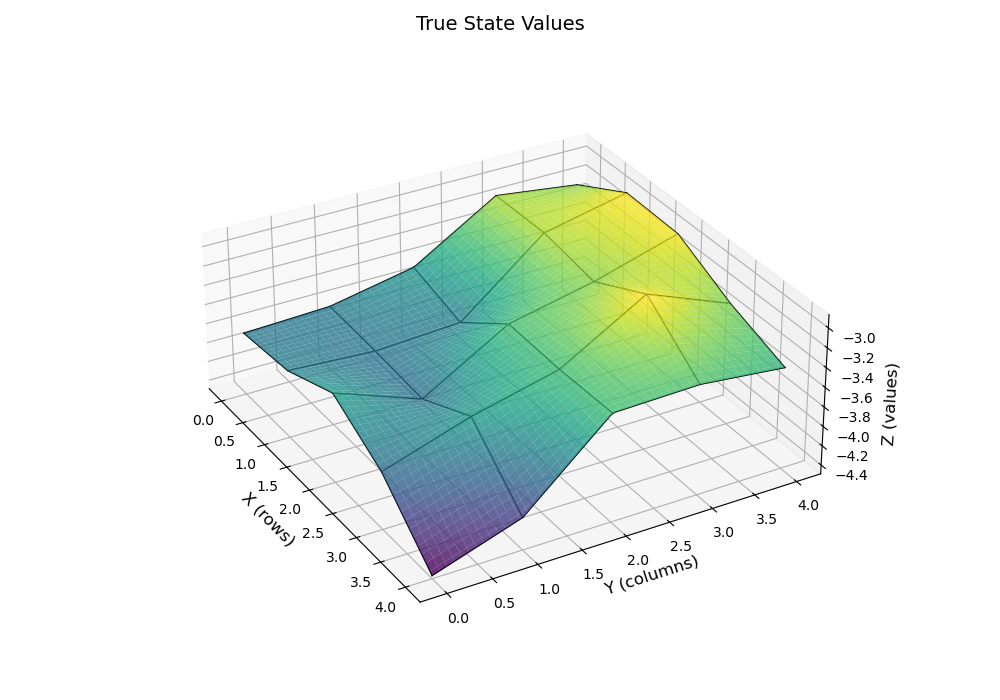
Consider a 5x5 grid-world example:

- Given a policy for any
- The rewards are , , and
- The goal is to estimate the state values of this policy
- There are 25 state values in total
- TD-Table: 25 parameters
- TD-Linear: less than 25 parameters
通过之前的policy evaluation的方法,我们可以得到ground truth的state values
| True State Values 2D | True State Values 3D |
|---|---|
 |  |
下面我们分别使用TD-Table和TD-Linear来估计这些state values,其中
- 500 episodes were generated following the uniform policy
- each episode has 500 steps and starts from a randomly selected state-action pair(following a uniform distribution)
- TD-Table:
- TD-Linear: ,
自己实现的结果如下:
| TD-Table | TD-Linear() |
|---|---|
.png) | .png) |
RMSE结果对比:
_vs_Episodes.png)
More Details
- the code above is open-source at donglinkang2021/grid_world
- more about the basis function result, see
- more about how to visualize a matrix see visualize_matrix
Summary of the story
- objective function:
- gradient-descent algorithm:
- the true value function is replaced by an approximation :
Theoretical analysis (optional)
The algorithm
does not minimize the following objective function:
- Objective function 1: True value error where and is a diagonal matrix(each element is the stationary distribution of the corresponding state)
- Objective function 2: Bellman error where
- Objective function 3: Projected Bellman error where is a projection matrix
- The TD-Linear algorithm minimizes the projected Bellman error